Not affiliated with Epic Games, Psyonix, BLAST, or Rocket League.
RAE's Birmingham Open #3 and Major Odds (Week One)
Who does the rating system predict to make it to Birmingham?
![]()
The race for the RLCS 2025 Birmingham Major is heating up. Europe,
South America, and Asia-Pacifc will be sending a collective seven representatives to
England, of which we know two:
What is RAE?
Alright, I probably owe you an explanation of what exactly RAE is.
RAE, or Region-Adjusted Elo, is exactly what it sounds like: Each team is given an Elo (or skill rating), which is adjusted based on their region. Elo specifically is based off the assumption that a team's skill level in any given match is normally distributed. If you want to learn more about the math behind it, I'd recommend watching this video by j3m.
I've been updating RAE Ratings for the RLCS in some form since the 2021-22 season, which technically makes me the first person to keep track of team ratings in RLCS, to my knowledge – RocketScience first created his system prior to the 21-22 Spring Major. The very first system I used went off of team placements instead of match results, which made it a pretty poor predictor of results. I switched to a proper rating system for the 2022-23 season, and got to a working version I was happy with in 2024, when I finally began tracking region ratings formulaically instead of estimating them by hand.
RAE has always been maintained on spreadsheets, and as of now that's where you can find all of its detailed rankings and predictions – though I did finally get a working version of the rankings list up a few days ago, which included me learning how to use JavaScript for the first time. The rankings are automated and update alongside the spreadsheet – I'll work on getting more functionality onto this site soon enough.
Anyways, getting back on topic, RAE ratings are relative, meaning that how likely a team is to win a series against any other team is determined by the difference in their two ratings. What rating differences correspond to what win probabilities is roughly as follows:
- 50 rating difference: ~57% win in a Bo5, ~58% in a Bo7
- 100: ~64%, ~66%
- 200: ~76%, ~79%
- 300: ~84%, ~89%
- 400: ~91%, ~94%
These probabilities may seem fairly small, but they add up over the course of a tournament: For instance, Karmine Corp is only about ~150 rating clear of the rest of the field in EU, but (spoilers) win a majority of all simulations for the third Birmingham Open.
For each respective region, I run 50,000 simulations of its event. This number is a little low as far as simulating tournament odds goes, but does the job within ~2% of the mathematical probabilities for each outcome. Why don't I use more simulations? Because my Python code is inefficient, bloated, and built from a version I made three years ago when I was even worse at programming.
I run 1,000,000 simulations of each regions' respective event, which does well enough to get within ~0.5% of the theoretical probabilities for each outcome. For any mid-day odds updates you might see, those will likely use 100,000 simulations instead, in order to save time.
Just a few more things before I get to the actual predictions:
I am currently testing an alternative region rating system. I'll weigh its performance against the current model's for the Birmingham Major and proceed from there.
RAE uses Elo, not Glicko. Glicko is a version of Elo that adjusts for uncertainty for teams with fewer games played (in mathematical terms, adjusts the standard deviation of the normal distribution of skill for each team rather than just the mean). RocketScience's model used Glicko.
Don't expect anything much on here for a while. The spreadsheet will always have the most up-to-date info available, though, and I encourage keeping an eye on it.
All series scores and results are entered by hand, including the updating of the rankings page on this website. If results take a while to be processed, that's why. It's also the reason why these ratings are limited to RLCS only. Maybe I'll consider automating it over the offseason if octane.gg comes back.
Alright. Without further ado, let's get into which teams the RAE model predicts are headed to Birmingham.
Europe
Both in rating and on the field,
Let's go over some of the more controversial picks.
Why are Gentle Mates and Geekay so high?
The reason for these two teams' persistence in the top six boils down to the pre-season initial ratings and their results on the field.
Pre-season ratings are based on the ratings of each of the players'
teams the previous season (I don't have individual player ratings – I don't plan to
create them for the time beingm either). Due to this,
The reason for the
As for
The real question you should be asking is why
How are Synergy and Redemption both top 10?
Same story, different chapter.
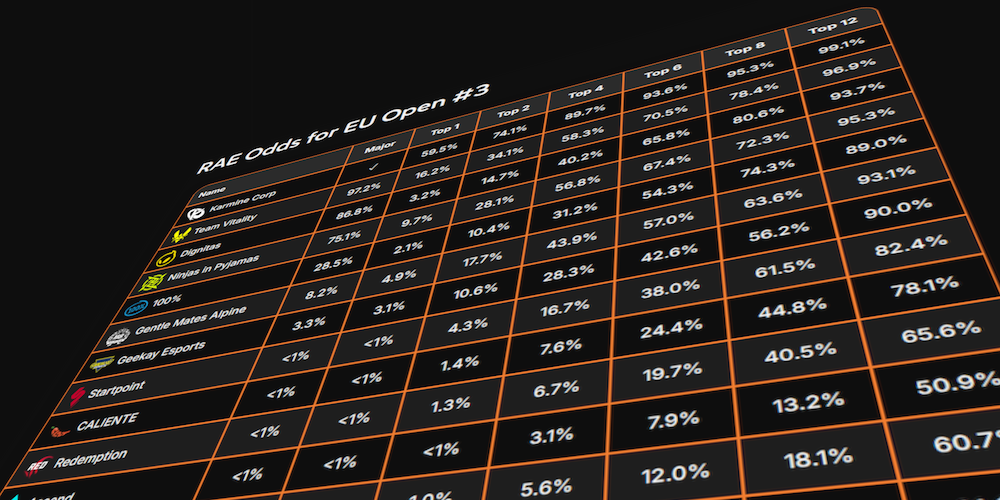
RAE Odds for EU Open #3
| Team | Major | Top 1 | Top 2 | Top 4 | Top 6 | Top 8 | Top 12 |
|---|---|---|---|---|---|---|---|
 Karmine Corp Karmine Corp |
✓ | 59.5% | 74.1% | 89.7% | 93.6% | 95.3% | 99.1% |
 Team Vitality Team Vitality |
97.2% | 16.2% | 34.1% | 58.3% | 70.5% | 78.4% | 96.9% |
 Dignitas Dignitas |
86.8% | 3.2% | 14.7% | 40.2% | 65.8% | 80.6% | 93.7% |
 Ninjas in Pyjamas Ninjas in Pyjamas |
75.1% | 9.7% | 28.1% | 56.8% | 67.4% | 72.3% | 95.3% |
 100% 100% |
28.5% | 2.1% | 10.4% | 31.2% | 54.3% | 74.3% | 89.0% |
 Gentle Mates Alpine Gentle Mates Alpine |
8.2% | 4.9% | 17.7% | 43.9% | 57.0% | 63.6% | 93.1% |
 Geekay Esports Geekay Esports |
3.3% | 3.1% | 10.6% | 28.3% | 42.6% | 56.2% | 90.0% |
 Startpoint Startpoint |
<1% | <1% | 4.3% | 16.7% | 38.0% | 61.5% | 82.4% |
 CALIENTE CALIENTE |
<1% | <1% | 1.4% | 7.6% | 24.4% | 44.8% | 78.1% |
 Redemption Redemption |
<1% | <1% | 1.3% | 6.7% | 19.7% | 40.5% | 65.6% |
 Ascend Ascend |
<1% | <1% | <1% | 3.1% | 7.9% | 13.2% | 50.9% |
 Synergy Synergy |
<1% | <1% | 1.0% | 5.6% | 12.0% | 18.1% | 60.7% |
 RRG RRG |
<1% | <1% | <1% | 3.6% | 14.4% | 30.2% | 61.9% |
 JJROX JJROX |
<1% | <1% | <1% | 3.4% | 14.3% | 31.1% | 66.3% |
 F4WD F4WD |
<1% | <1% | <1% | 5.0% | 17.3% | 37.1% | 63.0% |
 Sick! Sick! |
<1% | <1% | <1% | <1% | 1.0% | 3.0% | 14.1% |
Thanks in part to their favorable bracket,
Speaking of the two underperformers,
South America
Mirroring Europe, SAM sees
Is FURIA really the second best team in the world?
Short answer: Kinda?
Long answer: The fact that
The reason for this is fairly simple:
**The average gap in RAE between a region's best and second best team is 110 rating points, while the average gap between 1st and 3rd is 174 points. This is similar to last season, but well off from 22-23 – the average gaps were 77 and 93, respectively, with most of the difference being made up by APAC and SSA.
RAE Odds for SAM Open #3
| Team | Major | Top 1 | Top 2 | Top 4 | Top 6 | Top 8 | Top 12 |
|---|---|---|---|---|---|---|---|
 FURIA Esports FURIA Esports |
✓ | 65.4% | 80.1% | 94.6% | 97.0% | 97.9% | >99% |
 Team Secret Team Secret |
96.8% | 18.4% | 46.8% | 78.4% | 89.6% | 94.6% | 99.4% |
 Corinthians Esports Corinthians Esports |
1.1% | 6.9% | 25.1% | 59.8% | 77.6% | 84.5% | 97.7% |
 Godfidence Godfidence |
1.1% | 2.8% | 12.8% | 37.9% | 57.7% | 69.5% | 96.0% |
 Blazar Blazar |
<1% | 2.9% | 14.4% | 42.9% | 66.6% | 79.0% | 92.4% |
 Novus Aevi Novus Aevi |
<1% | 2.0% | 8.6% | 25.6% | 45.6% | 62.0% | 92.5% |
 Team Reds Team Reds |
<1% | <1% | 5.0% | 18.8% | 41.0% | 64.7% | 95.9% |
 Moonrise Moonrise |
<1% | <1% | 2.9% | 13.6% | 31.5% | 49.1% | 76.0% |
 Fear of God Fear of God |
<1% | <1% | 1.0% | 6.6% | 19.0% | 33.7% | 81.6% |
 Yonkō Yonkō |
- | <1% | 2.0% | 9.4% | 23.6% | 41.1% | 81.1% |
 Génesis Génesis |
- | <1% | 1.0% | 7.1% | 24.4% | 46.4% | 71.5% |
 Gratia Gratia |
- | <1% | <1% | 3.8% | 15.8% | 34.2% | 60.1% |
 LUK Esports LUK Esports |
- | <1% | <1% | <1% | 2.6% | 7.0% | 26.9% |
 Papo de Visão Papo de Visão |
- | <1% | <1% | <1% | 3.5% | 16.2% | 49.8% |
 FOFOS FOFOS |
- | <1% | <1% | <1% | 3.2% | 15.8% | 54.9% |
 True Neutral Black True Neutral Black |
- | <1% | <1% | <1% | 1.5% | 4.4% | 24.6% |
Asia-Pacific
And again, there's a clear top team in
How are import teams seeded?
I really don't have anything to add regarding the APAC Open itself, so I'm going to use this slot to talk about how I seed import rosters in APAC and SSA.
New players qualify for regionals all the time; I seed them using the Non-Qualifying Team ratings that you may have seen on the global rankings. However, import players are odd, because they are better than their new region's non-qualifying players but worse than their old region's ones.
If they were on a team that had a rating in the past, I will use that and adjust it for updates across seasons. If they were a bubble player (consistent top ~32), I will use their old region's non-qualifying team rating – I did so for
If the import player wasn't competing seriously in their old region, I just kind of wing it. This is probably bad practice, but unless a team is clearly better than the rest of the region, the ratings will get to the right values eventually. It was a bit of a problem with
RAE Odds for APAC Open #3
| Team | Major | Top 1 | Top 2 | Top 4 | Top 6 | Top 8 | Top 12 |
|---|---|---|---|---|---|---|---|
 Luminosity Gaming Luminosity Gaming |
98.9% | 59.4% | 77.4% | 94.9% | 97.5% | 97.9% | >99% |
 Elevate Elevate |
1.1% | 22.2% | 52.7% | 86.4% | 95.7% | 98.1% | >99% |
 Overlooked Overlooked |
- | 10.3% | 30.7% | 65.0% | 81.0% | 85.4% | 93.3% |
 Lokomotiv eSports Lokomotiv eSports |
- | 4.9% | 20.1% | 58.9% | 84.0% | 93.1% | 98.3% |
 KINOTROPE gaming KINOTROPE gaming |
- | 1.4% | 7.1% | 27.3% | 49.9% | 60.7% | 79.8% |
 Dekubopdumnem Dekubopdumnem |
- | 1.2% | 6.3% | 25.1% | 47.4% | 58.6% | 78.6% |
 God Speed God Speed |
- | <1% | 2.2% | 14.7% | 40.9% | 68.6% | 92.2% |
 Blue Torch Blue Torch |
- | <1% | 1.3% | 7.9% | 23.0% | 35.2% | 85.1% |
 SENZA Esports SENZA Esports |
- | <1% | 1.0% | 7.1% | 19.2% | 28.8% | 48.3% |
 Jungle Juicers Jungle Juicers |
- | <1% | <1% | 4.9% | 19.8% | 50.9% | 88.3% |
 Revenue Redeemers Revenue Redeemers |
- | <1% | <1% | 3.3% | 12.5% | 23.0% | 72.9% |
 Machi's Minions Machi's Minions |
- | <1% | <1% | 1.2% | 5.3% | 10.6% | 42.4% |
 Eleoroo Eleoroo |
- | <1% | <1% | 1.5% | 8.9% | 32.9% | 75.0% |
 Executioners Executioners |
- | <1% | <1% | 1.1% | 7.2% | 26.0% | 60.5% |
 Small Esports Small Esports |
- | <1% | <1% | <1% | 5.3% | 19.6% | 49.1% |
 Southwest Side Southwest Side |
- | <1% | <1% | <1% | 2.5% | 10.9% | 37.1% |
To summarize, here's who RAE thinks qualifies for the major out of each region:
- EU:
Karmine Corp ,Team Vitality ,Dignitas ,Ninjas in Pyjamas - SAM:
FURIA Esports ,Team Secret - APAC:
Luminosity Gaming
It's all chalk! Maybe I didn't need to draft a 2,000 word write-up, after all.
To be a little fair to the RAE model and my time, most regions went exactly according to the script, and the only regions with real major races are NA, EU, and OCE (to give you a preview of next week, RAE probably won't see NA as all that close; it has SSG as NA9). So, in general, not much good analysis to be done there.
Lastly, I'd like to take a moment to give a shoutout to RocketScience. If it wasn't painfully obvious, I ripped a ton from his website, and by a ton, I mean all of the CSS and most of the HTML that I could. I guess me learning how to use JavaScript was an appropriate punishment. Go ahead and give him a sub and follow him on Twitter.